
The U-M School of Nursing has produced brilliant caregivers throughout its 126-year history with alumni on the job in clinics and hospitals the world over. Now, though, the times are calling for UMSN graduates to lead in an area removed from conventional caregiving. Nurses and other clinicians on the front lines are not just at bedsides but in front of EHR (electronic health record) screens, interpreting patient information. Behind these frontline caregivers stand ranks of researchers highly skilled in mining, harmonizing, wrangling, synthesizing and drawing usable results from the growing mountains of information called “big data,” much of it harvested from clinical information systems and devices that form “the Internet of things.”
The amount of data at our disposal doubles every 12 to 14 months, yet our ability to process it doubles only every 18 months. We are the Sorcerer’s Apprentice, the brooms are our machines, and the water is rising.
How do we channel all that “water” to do the most good for humankind? If treated, manipulated and visualized in the right way—a way we might not even have imagined at first—those bursting repositories might yield clues to a patient’s risk for disease or death. Furthermore, those repositories may inform highly personalized health care, might inspire innovations in the ways clinicians jointly interact with the data itself to transform health care planning, and might lend new insights into the ways we organize our health care delivery systems. We are still in the early stages of realizing the benefits big data can deliver.
But, based on what we want to know, how do we identify the right data? Where are these data buried, and how? With big data, you don’t start with a hypothesis, e.g., “We should dig here to prove X,” like a dog digging for a bone. With big data, we may be digging for a whole skeleton without knowing it. And unlike the dog, we do not cast aside
the dirt. We learn from it, too. Context and relationships of data matter. Finding and visualizing those relationships makes masses of often highly imperfect data usable. At the School of Nursing, working with big data sets is part of an exciting research agenda—one broader than that of many nursing schools, and one that has involved many from outside the nursing profession.
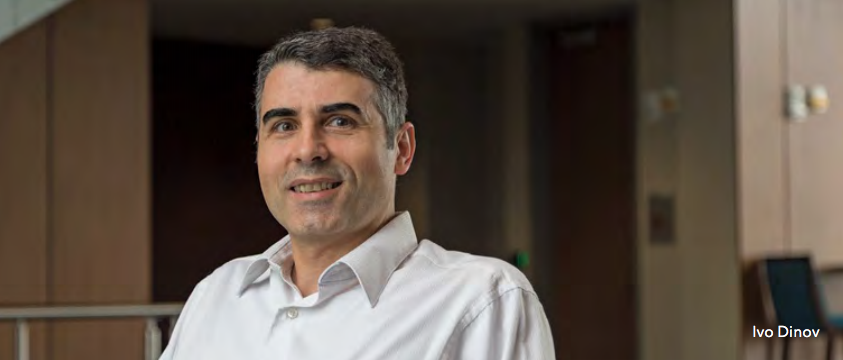
Among these is Associate Professor Ivo Dinov, Ph.D., director of the Statistics Online Computational Resource (SOCR, which makes hundreds of data analytics applets and thousands of online resources available at socr.umich.edu). Dinov believes big data will “shape the next generation of health scientists, advance health science education, and have a powerful impact on patient care.” Toward this end he has, unlike many researchers, made his own work in the field entirely public via SOCR and other channels.
DEFINING BIG DATA
If you are annoyed by the ambiguity of the phrase “big data,” because you’ve never been sure what it means, know that, even among researchers, there is not complete agreement.
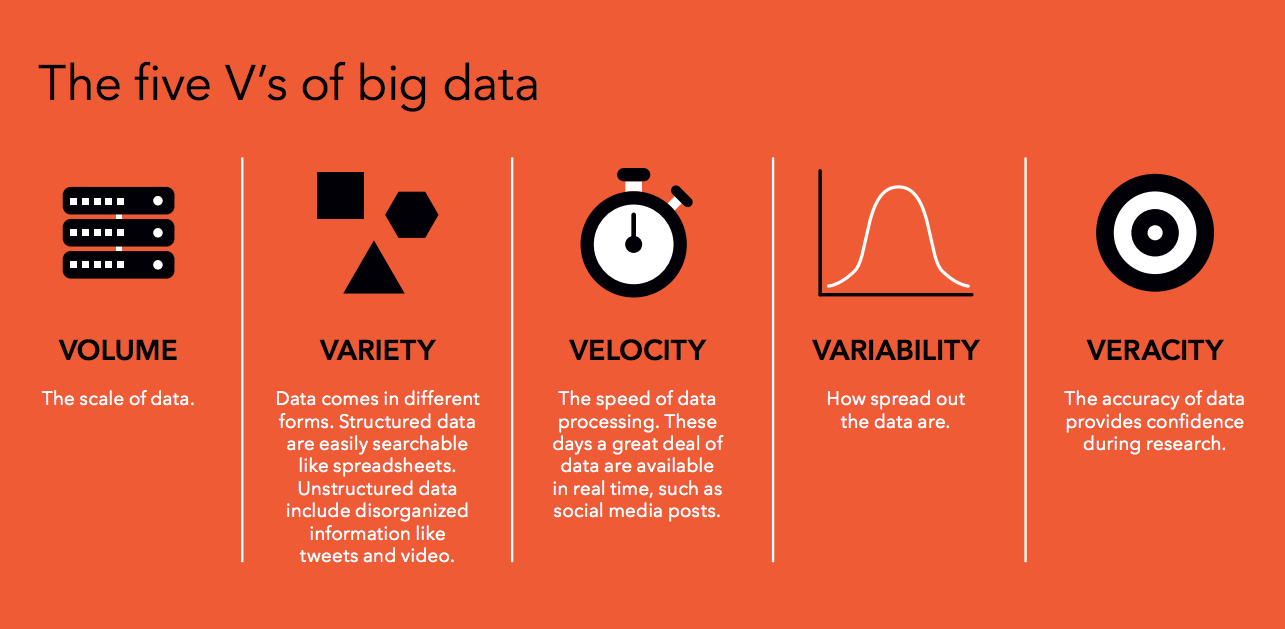
Researchers do agree that big data sets can be characterized in terms of “five V’s”—tremendous volume, variety, velocity, variability, and questionable veracity of individual records. Big data can be so big—Dinov is working with one set of two petabytes, that is, two billion megabytes—and so non-homologous that we can’t approach it with conventional analytics. Rather, we let it approach us, or at least meet us halfway.
Via “machine learning,” it is the actual processing of the data—within parameters that we determine—that finds patterns that might point to the causes or predict the progression of a disease, or might pinpoint inefficiencies in a patient’s clinical and administrative journey from ER to recovery.
FINDING APPROVAL
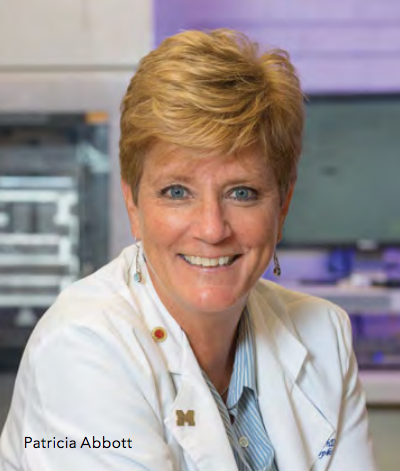 It took time for machine learning to gain acceptance. Dinov’s colleague and collaborator, UMSN Associate Professor Patricia Abbott, Ph.D., RN, FAAN, remembers when she entered the field in the 1990s.
“I looked at huge amounts of data with no a priori hypotheses,” she says. “They told me, ‘You’re fishing. You have to follow a biomedical model. You must have a research question.’” Abbott’s critics turned out to be wrong. She wasn’t fishing. But it says something about the nature of big data and our relationship to it that, even today, she speaks of “wandering around” in big data sets.
Trained as a nurse, Abbott got the analytics bug when she brought together the Minimum Data Set collected by the U.S. Government from Medicare- and Medicaid- certified nursing homes; and previously languishing longitudinal clinical data on the health of individual nursing home residents. Linking government data (much of it messy) to facility-level data allowed Abbott to examine questions related to nursing home funding, staffing ratios, and other health and administrative issues. “Following the money” (and saving it) is often the reason for excursions into big health data sets.
Abbott then became interested in data visualization. You can feed a machine the high volumes of data being discussed here, but the patterns found may not make sense or be actionable until they are visualized and interpreted.
“Looking for patterns is a skill,” says Dinov, and Abbott adds that that includes knowing when you are not onto something.
She cites the Dilbert strip in which Dogbert tells the boss, “Sales to left-handed squirrels are up, and God doesn’t like your tie.” As Abbott puts it, “Patient deaths might legitimately correlate with zip code, but you’d be wary of a correlation with pets’ names.” The danger exists that even professionals may latch onto something much in the news these days: alternative facts.
INNER BEAUTY
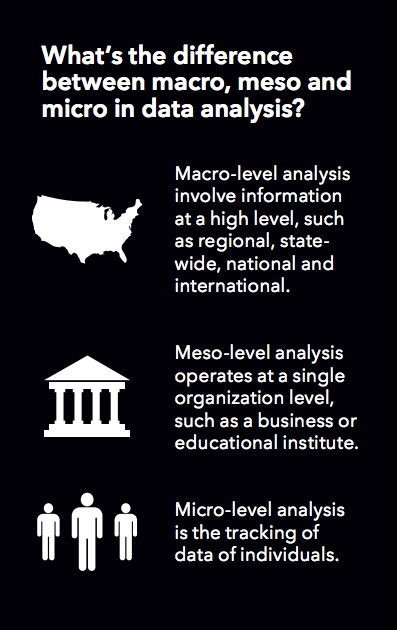 Health science data sets are characterized in ways that track the five V’s: the size of the data set; its completeness; its complexities and incongruities (e.g., varying file formats); multiple scales (you may simultaneously deal with macro, meso, and micro levels); and (in)congruity across multiple sources (some places keep better records than others). Data sets are not consistently structured. They pass through a number of processes that we uninitiated collectively call “scrubbing” before software can even work with them, let alone extract sensible patterns. These tasks are carried out by processors sometimes having thousands of cores, as opposed to the two or four that you or I would have.
Once data are harmonized and synthesized, the results can be spectacular. Using multi-source big data, including imaging, genetics, clinical and cognitive information, Dinov can build and explore in detail a three-dimensional image of a human brain on his computer screen. Leading a fantastic voyage inside it he concludes, speaking perhaps of the brain itself, of the image, of the elegant process that built it, or of all these: “You can see how beautiful it is.”
Brain imaging or similar data may then be combined with scrubbed clinical, genetic, and demographic data into a unique quantitative summary, “an eight- fingered hand,” in Dinov’s words, that can be visualized onscreen for the researcher in many ways to answer many questions. One project on which Dinov has worked shows how reaching out and shaking an eight-fingered hand may help health professionals improve patients’ lives.
A FAMOUS PATIENT
In 1990, at age 29, the actor Michael J. Fox was diagnosed with Parkinson’s Disease. He founded the Michael J. Fox Foundation to help find a cure and to improve therapies for those suffering. The foundation’s priorities include early, accurate detection and prediction of the disease’s course in individuals. What if one’s nurse, general practitioner or physician assistant could access a quantitative summary, an eight- fingered hand, from an in-office desktop or laptop and thus make accurate predictions about the course of their patient’s disease?
We start with data from a Fox Foundation study called the Parkinson’s Progression Markers Initiative (PPMI). Some 1,000 Parkinson’s patients contributed personal data and biosamples to a database and specimen bank, accessible to researchers online. PPMI data includes: three- and four- dimensional MRIs; patients’ genetic data; their clinical data; and their demographic data. Thinking of the characteristics of big data sets, we note that: the Fox Foundation study has data from multiple sources; the volume is large (up to 100 MB for a single MRI); it is heterogeneous, comprising spreadsheets, long byte arrays, and more; it is not homologous, that is, missing pieces vary from one record to the next; and it is multi-scale. MRI data in particular are key to distinguishing slow- from fast-progressing Parkinson’s, as are longitudinal clinical data obtained through the Unified Parkinson Disease Rating Scale (UPDRS), which the PPMI study uses to group patients with similar disease progressions. MRI data are especially helpful, as certain brain patterns differ between patients with slow- versus fast-progressing Parkinson’s.
To build this particular eight-fingered hand, MRIs and other UPDRS clinical data are combined with demographic data, genetic risk scores and select biomarkers to forecast if a patient will have slow or fast progressing Parkinson’s. Unlike traditional analytics, which rely on counting, summing, averaging and the creation of result sets. Big data are too big and varied to be processed under close human direction. Instead we build our fantastical hand with machine learning, which will extract results—including some not necessarily looked for by human investigators—from vast, complex, and disparate data sources. Machine learning thrives on being fed ever more data, which actually teach the system to produce higher quality insights. In other words, yes, the machines are taking over. And, if you have or might have Parkinson’s, that is a good thing. The machine might find what a human might not think to look for.
IN PRACTICE
Now we must allow nurses, physicians, nurse practitioners, PAs, and others to shake the eight-fingered hand in their offices, reading its insights from a “dashboard” of data visualizations (graphs, scatter plots, etc.), in ways that can directly advance patient care. End users do not need much specialized training. The dashboard will be straightforward, democratic and inclusive, its visual constructs easily interrogated, manipulated and read.
Marcelline Harris, Ph.D., RN, associate professor in the UMSN’s Department of Systems, Populations and Leadership, studies the application of techniques for making data discoverable and usable.
“The goal is that software applications can ‘interpret’ the meaning of the data without labor intensive manual efforts,” says Harris. “And clinicians and researchers can more readily find, integrate and use the data.” Harris is working on a number of projects that typify her specific area of study within the field of big data.
“We are in the act of making data visible to researchers and policymakers,” says Dr. Harris.
But this act of making data visible raises a “meta” issue we have not yet addressed. Think of those PPMI specimens. Now think of Facebook and Twitter ads. How often do you hear, “I mentioned Dilbert once in an article, and now I’m buried in ads for Dilbert books? People think “the system” knows too much about us, and while an interest in Dilbert is harmless enough, data on our health is another matter.
One of Harris’s current projects focuses on the metadata [data about the data] of informed consent and biospecimens in biorepositories, such as those of the PPMI. Harris and her collaborators are introducing tools and models for making these data computable as they pass through different environments, from collection to computation.
“Researchers keep information about consent attached to specimens, so permissions to use the data are known to everyone,” says Harris. “For now, this remains mostly manual. But we are using metadata to tell us what patients have consented to. This makes sensitive information more computable.”
Given the complexities of the regulatory environment, and the ubiquity of technology, Harris stresses the importance of using solid scientific principles.
“We must have good science practices as well as good technological implementation,” she comments. “Compliance and security can’t be separate from research.” Harris is also working on an innovative project that allows data to be harnessed at a national scale for networked research.
“The result of this work will not be a centralized massive dataset, but a network with nodes (such as the University of Michigan or other participating health systems or universities), wherein each node maintains control and governance of data while participating in common research queries,” she concludes.
This particular project aims to bring the analytics to the data—where they reside. If Harris and her colleagues are successful, it will help build a new type of environment for clinical research.
“At the end of the day, our work on big data is about making the data systems work for improvements in health care delivery and health outcomes,” says Harris. “It’s about creating shareable tools for health care professionals; creating more transparency in research; and doing so with the utmost regard for and stewardship of the trust patients place in us when they agree to share their data for research.”
With the University of Michigan celebrating its bicentennial this year, we are inspired to ask, What is the future of big data? How will
it help inform the next generation? UMSN faculty working with big data are quick to note that the question is not really the future, per se, of big data, but what we do with the data. How do we harness the potential of big data to transform health care? As educators and researchers, how do UMSN students and faculty ensure that the enormous possibilities of big data are felt at the point of patient care?
The possibilities in big data can turn into enormous benefits for us all. In the days ahead, data may occupy caregivers even more than
it does now. But clinicians will return to the bedside better informed, with perhaps better news, based on better and better information.
You can see how beautiful it is.